

CdTeFPD
Detection Methods: Indirect Conversion and Direct Conversion
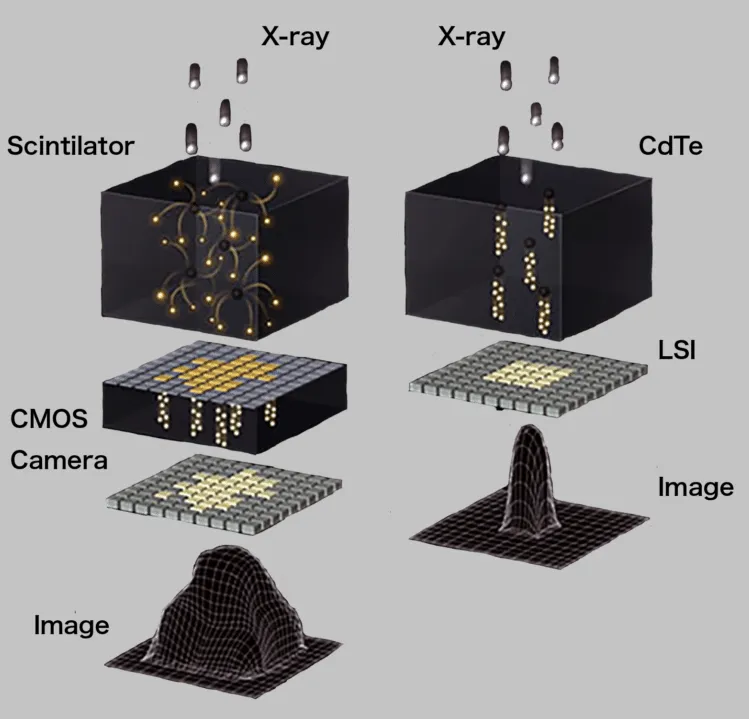
The left side of the figure below shows the indirect conversion type, in which X-rays are converted into light by a material called a scintillator, and that light is then received by a CMOS camera. When X-rays are converted into light, the direction of the light cannot be controlled, so it spreads out. This causes blurring in the image. Solutions include making the scintillator thinner to reduce spreading, or adding partition walls for each pixel to reflect the light. Both methods, however, reduce detection efficiency.
The right side of the figure below shows the direct conversion type, in which electrons generated by the interaction between X-rays and matter are processed as signals. Because a bias voltage is applied, spreading is kept to a minimum even when the sensor element is thick. High-contrast images can be obtained without sacrificing detection efficiency.
Measurement Methods: Integrating and Photon Counting
There are two main ways to process the signals obtained from a detector (camera). One is the integrating method, which accumulates the signals obtained over a fixed period of time. Since camera noise is accumulated as well, noise tends to become noticeable at low doses.
The other is the photon counting method, which counts photons, the smallest unit of light, one by one. This makes it possible to obtain noiseless images even at low doses.
Measurement Methods: Energy-Resolving Photon Counting
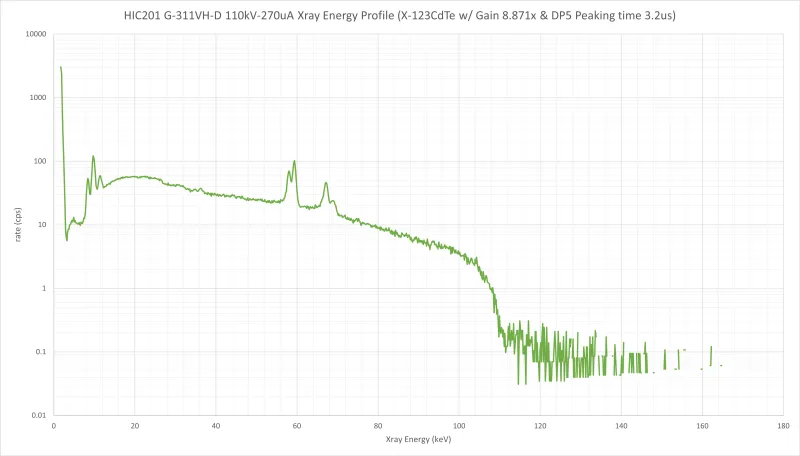
The photon counting method simply obtains the number of photons, discarding the energy information (wavelength) that each photon inherently carries. The energy-resolving photon counting method makes use of this energy information as well. It is typically represented as a histogram with photon count on the vertical axis and energy (keV) on the horizontal axis. Circuits that acquire the full spectrum are complex, and they are not widely used in large-area flat panels.
The figure below shows the results of measuring an X-ray tube with an MCA (multichannel analyzer). Ideally, this information would be available for every single pixel, but due to challenges such as circuit size, power consumption, heat generation and data transfer volume, this has not yet been achieved in large-area FPDs for X-ray cameras.
Measurement Methods: Global Shutter and Rolling Shutter
With a global shutter, all pixels are exposed simultaneously and the image is acquired at the same time. Because the entire image is captured at once, there is little blur even when imaging moving objects, enabling high-speed imaging.
With a rolling shutter, on the other hand, pixels are exposed in sequence and the image is acquired progressively. Because the image is acquired pixel by pixel, movement of the object or the camera can cause image distortion or motion blur, making it suitable for slow-moving objects and still images.
Visible-light CMOS sensors generally use a rolling shutter, and many scintillation-type detectors that borrow this technology use one as well. Recently, visible-light cameras with global shutters have also begun to appear on the market. ANSeeN FPDs use a global shutter, so images with little blur can be obtained even at high fps.
Why Large-Area Semiconductor Flat Panel Detectors Are Difficult
Semiconductor elements are more expensive to manufacture than scintillators, and crystal size is limited. A detector larger than the crystal size cannot be made.
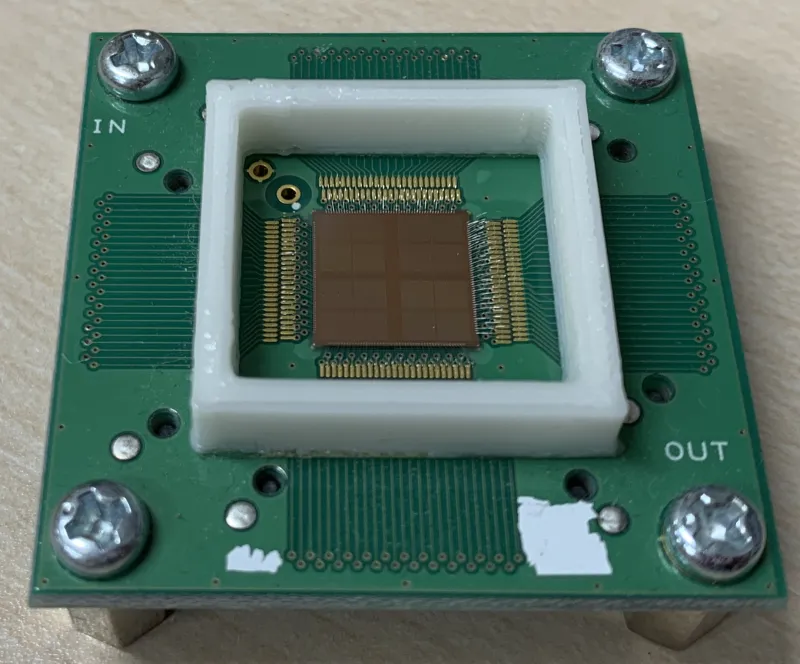
A readout integrated circuit (ROIC) is required beneath the semiconductor element, and the typical structure uses wire bonding to extract signals from the ROIC. This requires space for readout, so the elements could not be arranged two-dimensionally; only line sensors with elements arranged side by side could be made. The figure below shows an example in which the image sensor is read out from all four sides, a structure that does not allow tiling at all.
Larger Areas with 3DLSI
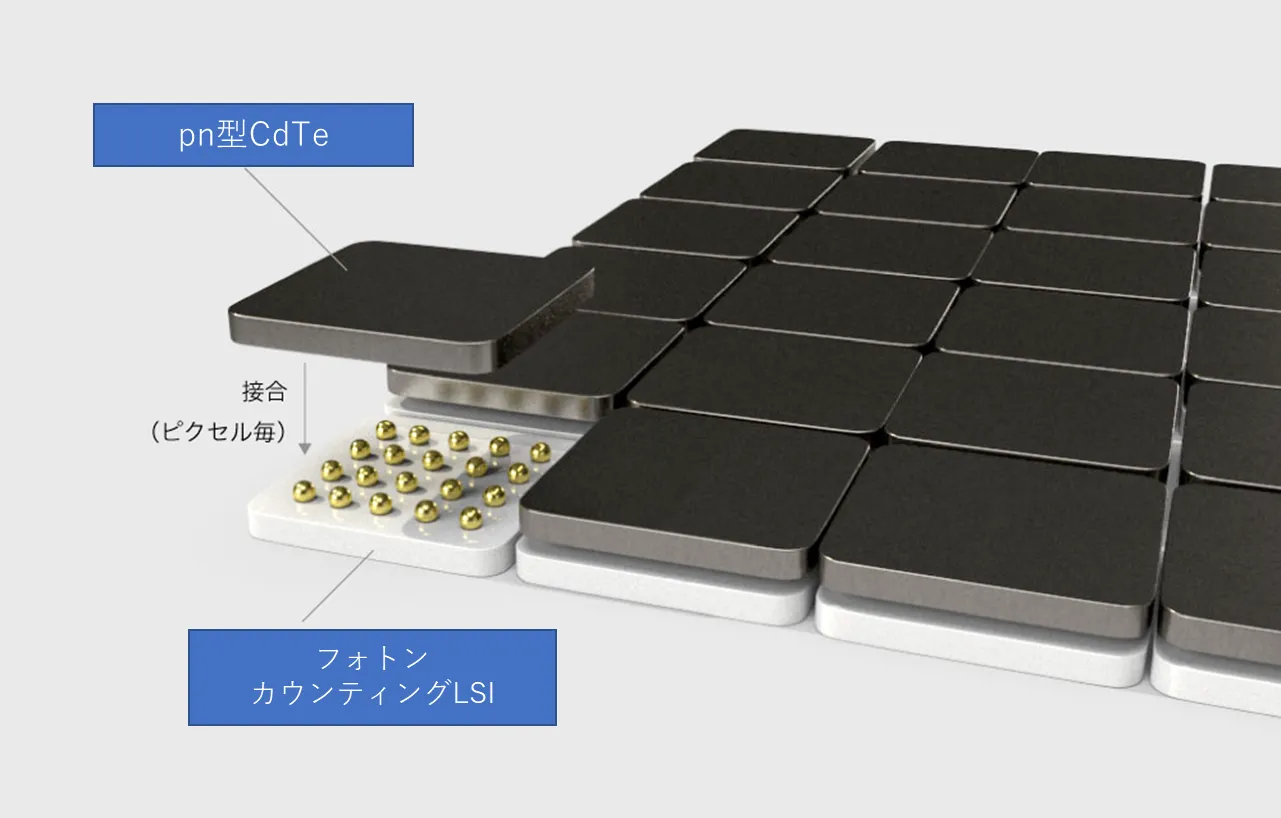
Conventional ROICs could be bonded on only one side, so readout space was required and they could not be arranged two-dimensionally (vertically and horizontally). To solve this problem, we designed, developed and manufactured in-house an LSI that can be bonded on both the front and back. This allows signals to be extracted directly beneath the ROIC, achieving a structure that requires no readout space. This has made larger areas possible.
Daisy Chaining and Frame Rate
Signals extracted directly beneath a module are passed to the adjacent LSI. That LSI then passes the received data, along with its own data, on to the next one. Although the transfer speed decreases as more modules are arranged horizontally, the result is an LSI that can be placed freely. Since any number of rows and columns is possible, both FPDs and line sensors can be implemented with the same LSI.
The maximum frame rate of a single module is 800fps, but it decreases as the number of modules arranged horizontally increases. For example, with 12 modules arranged horizontally, 800/12=66.666, giving a maximum of approximately 66fps.
ANSeeN CdTeFPD Measurement Modes
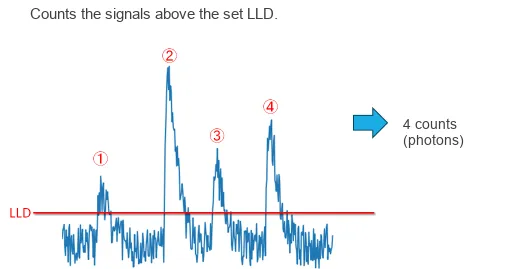
(1) Photon Counting Mode
The simplest mode, which outputs the number of photons. A threshold is set with the LLD to remove noise. Because energy information is not distinguished, a photon is output as a single count whether it is 40keV or 100keV.
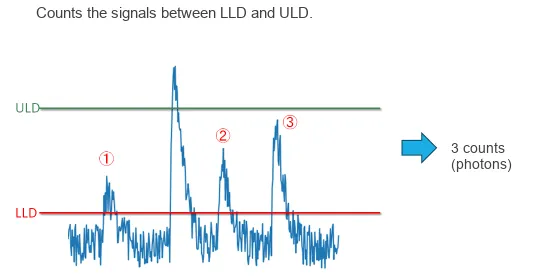
(2) Single-Threshold Mode
In addition to the LLD for noise removal, this mode also removes energies above a certain level. Photons with energies between the LLD and ULD are counted.
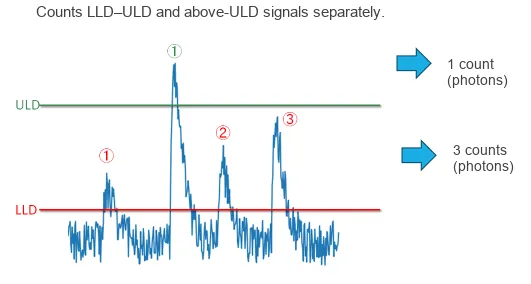
(3) Dual-Threshold Mode
In this mode, photons from the LLD to the ULD are output as low-energy counts, and those exceeding the ULD are output as high-energy counts. Because the data transfer volume doubles, the frame rate is half that of the other modes.
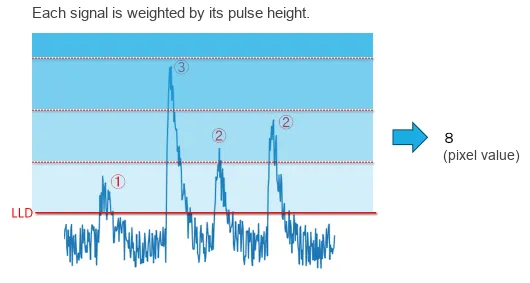
(4) MDEI Mode
Whereas the other modes output photon counts, this mode outputs energy-weighted pixel values. This makes it possible to obtain images similar to those of conventional integrating detectors, while also producing clear images free of the accumulated noise that was the weakness of the integrating method.
When imaging objects such as metals, materials that readily block X-rays transmit mostly high-energy photons. If only the number of photons is considered, however, contrast becomes weaker than with conventional imaging methods. Weighting high energies therefore yields images that look more natural.
Comparison of CMOS and CdTe
We compare the performance of a direct conversion CdTe semiconductor FPD with an indirect conversion CMOS scintillation FPD. The pixel size of the CMOS is about 1/4 that of the CdTe.
| PARAMETER | CMOS | CdTe |
|---|---|---|
| SCINTILLATOR TYPE | CsI:Tl | |
| TOTAL PIXEL MATRIX(Pixels) | 2400 x 3000 | 288 x 288 (3x3FPD) |
| 1152 x 1152 (12x12FPD) | ||
| PIXEL PITCH(μm) | 49.5 | 100 |
| A/D CONVERSION(bits) | 14(A/D Conversion) | 16(photon count) |
| FRAME RATE(fps) | 10 | 266 (3x3FPD) |
| 66 (12x12FPD) | ||
| ENERGY RANGE(kV) | 40 –225 | 40-450 |
Dynamic Range Comparison
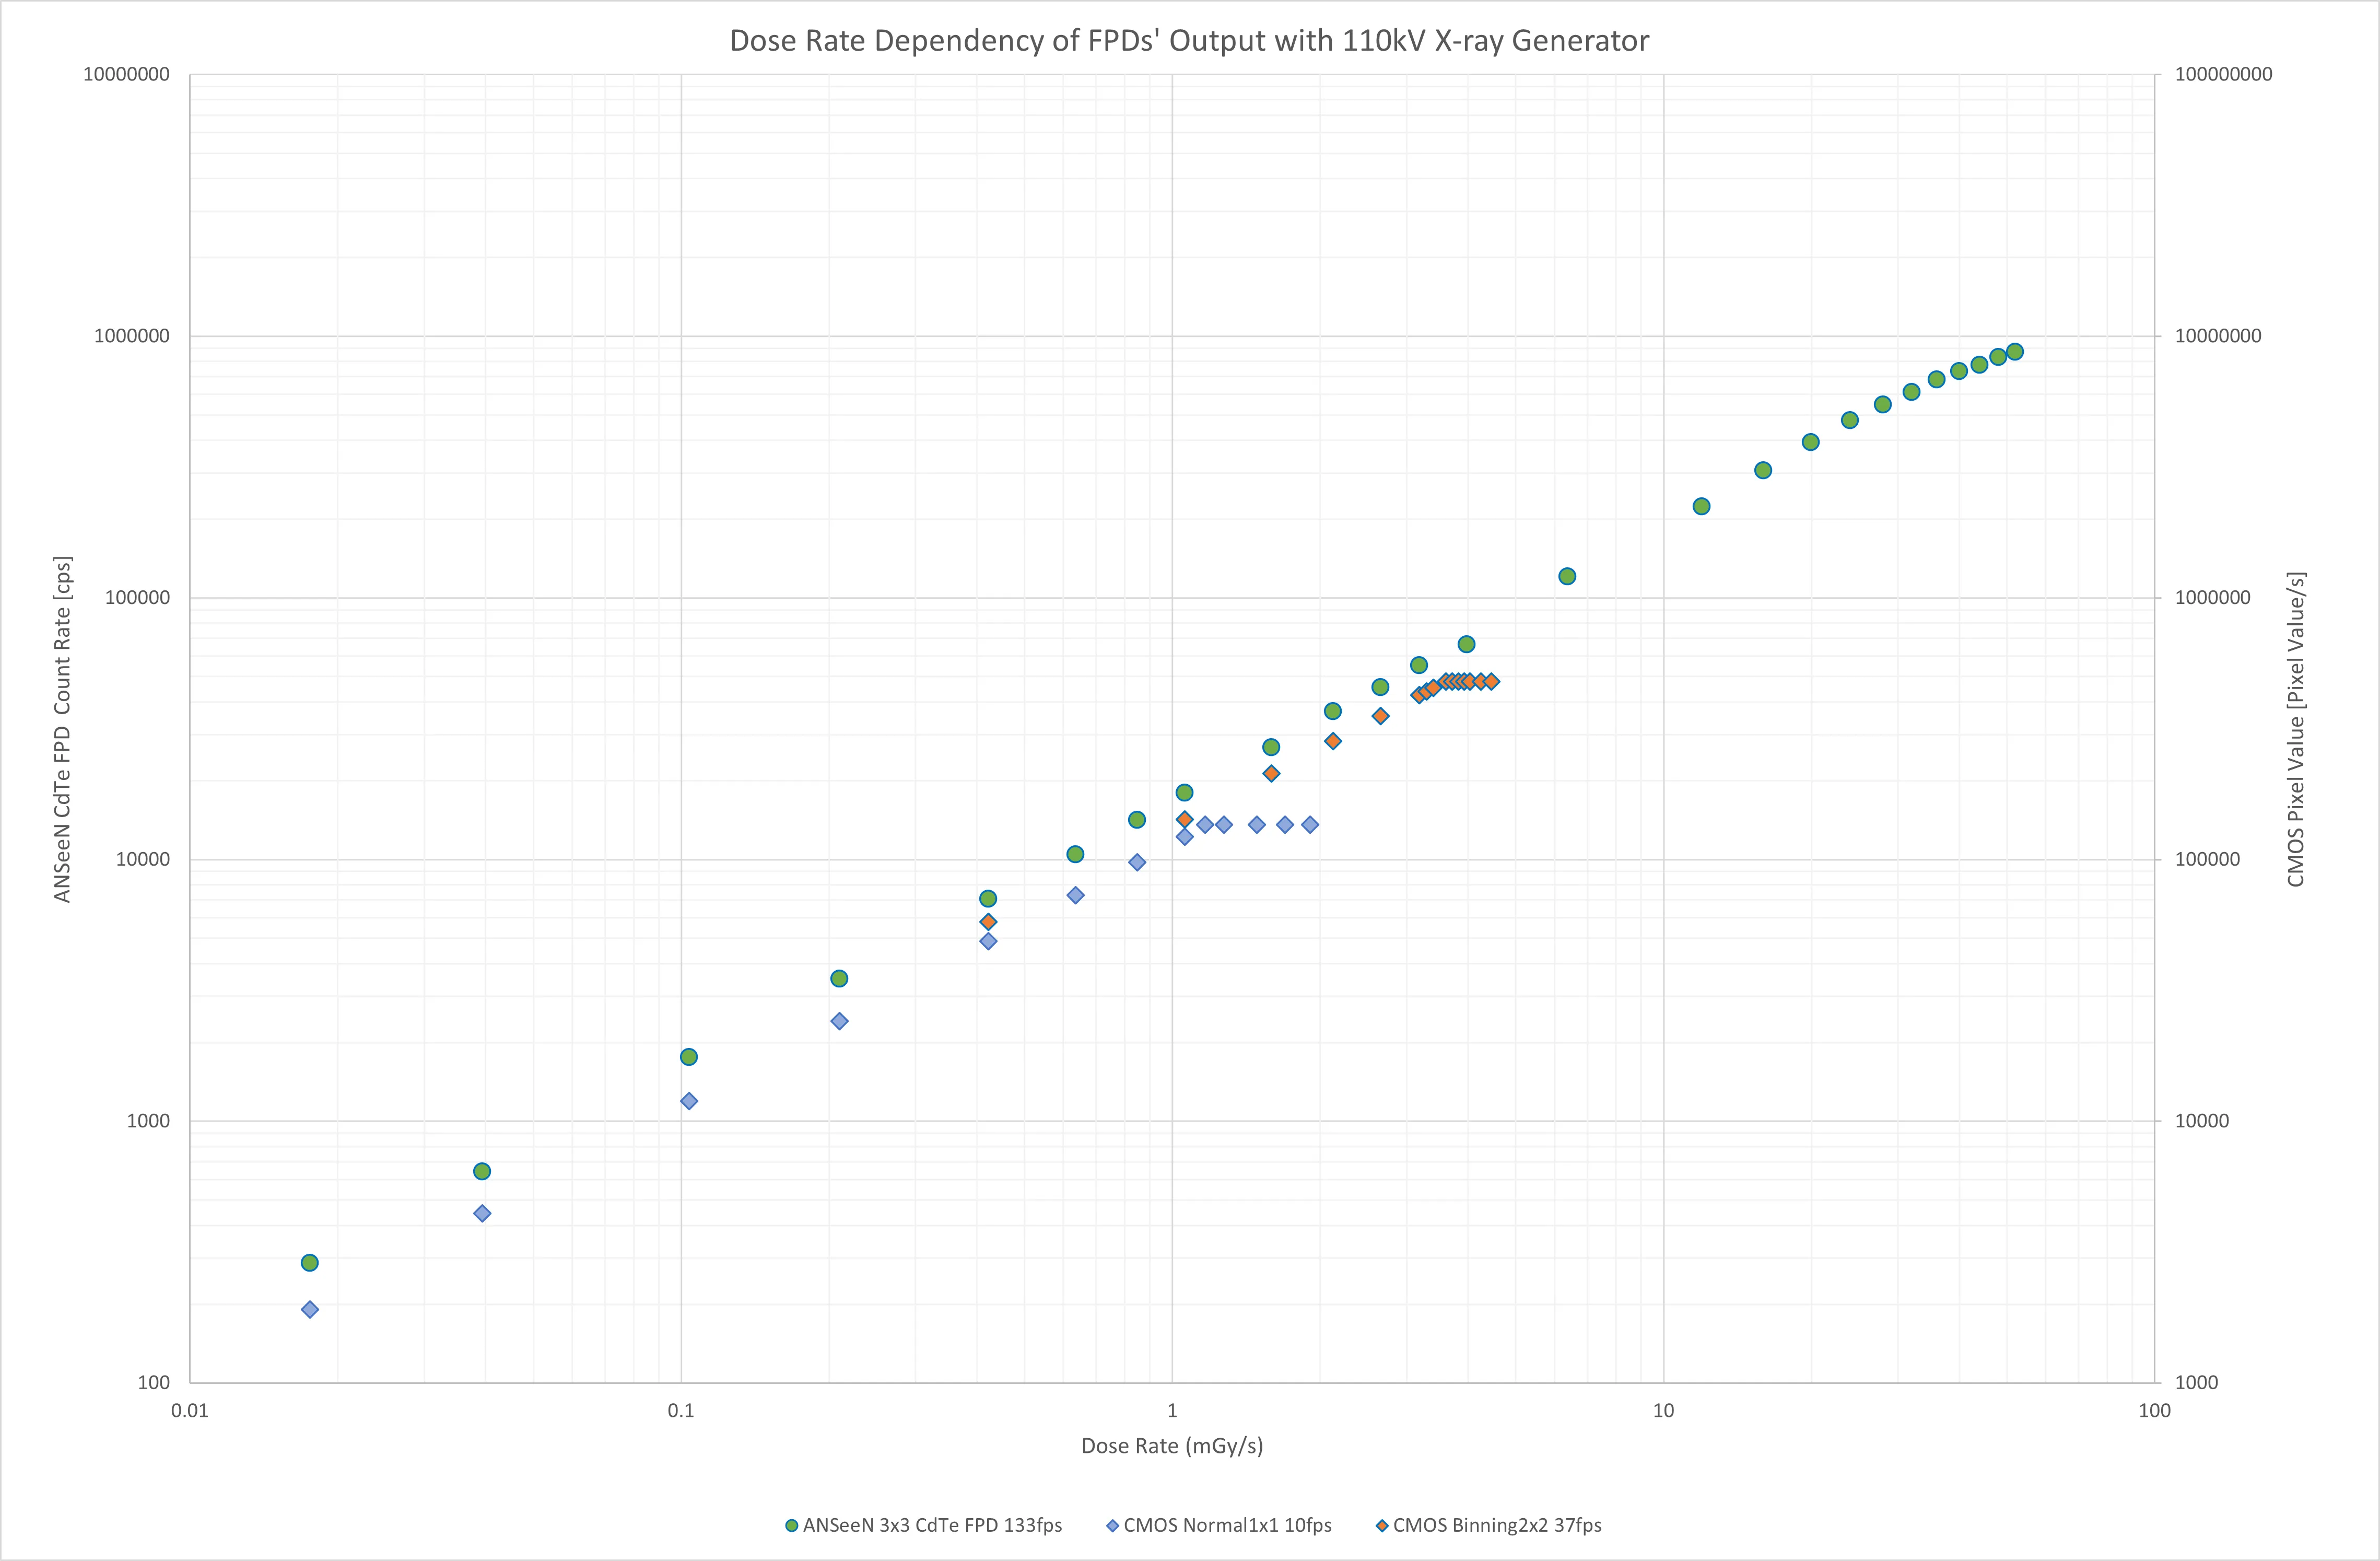
The figure below shows the dose rate dependence (typical pixel) of the CMOS in Normal (Full resolution) mode and Binning 2x2 mode, and of the ANSeeN CdTe FPD. Using a tube voltage of 110kV, each FPD imaged for 10 seconds at its fastest frame rate, and the integrated images were converted into pixel values and count values per unit time.
MTF (Edge Method)
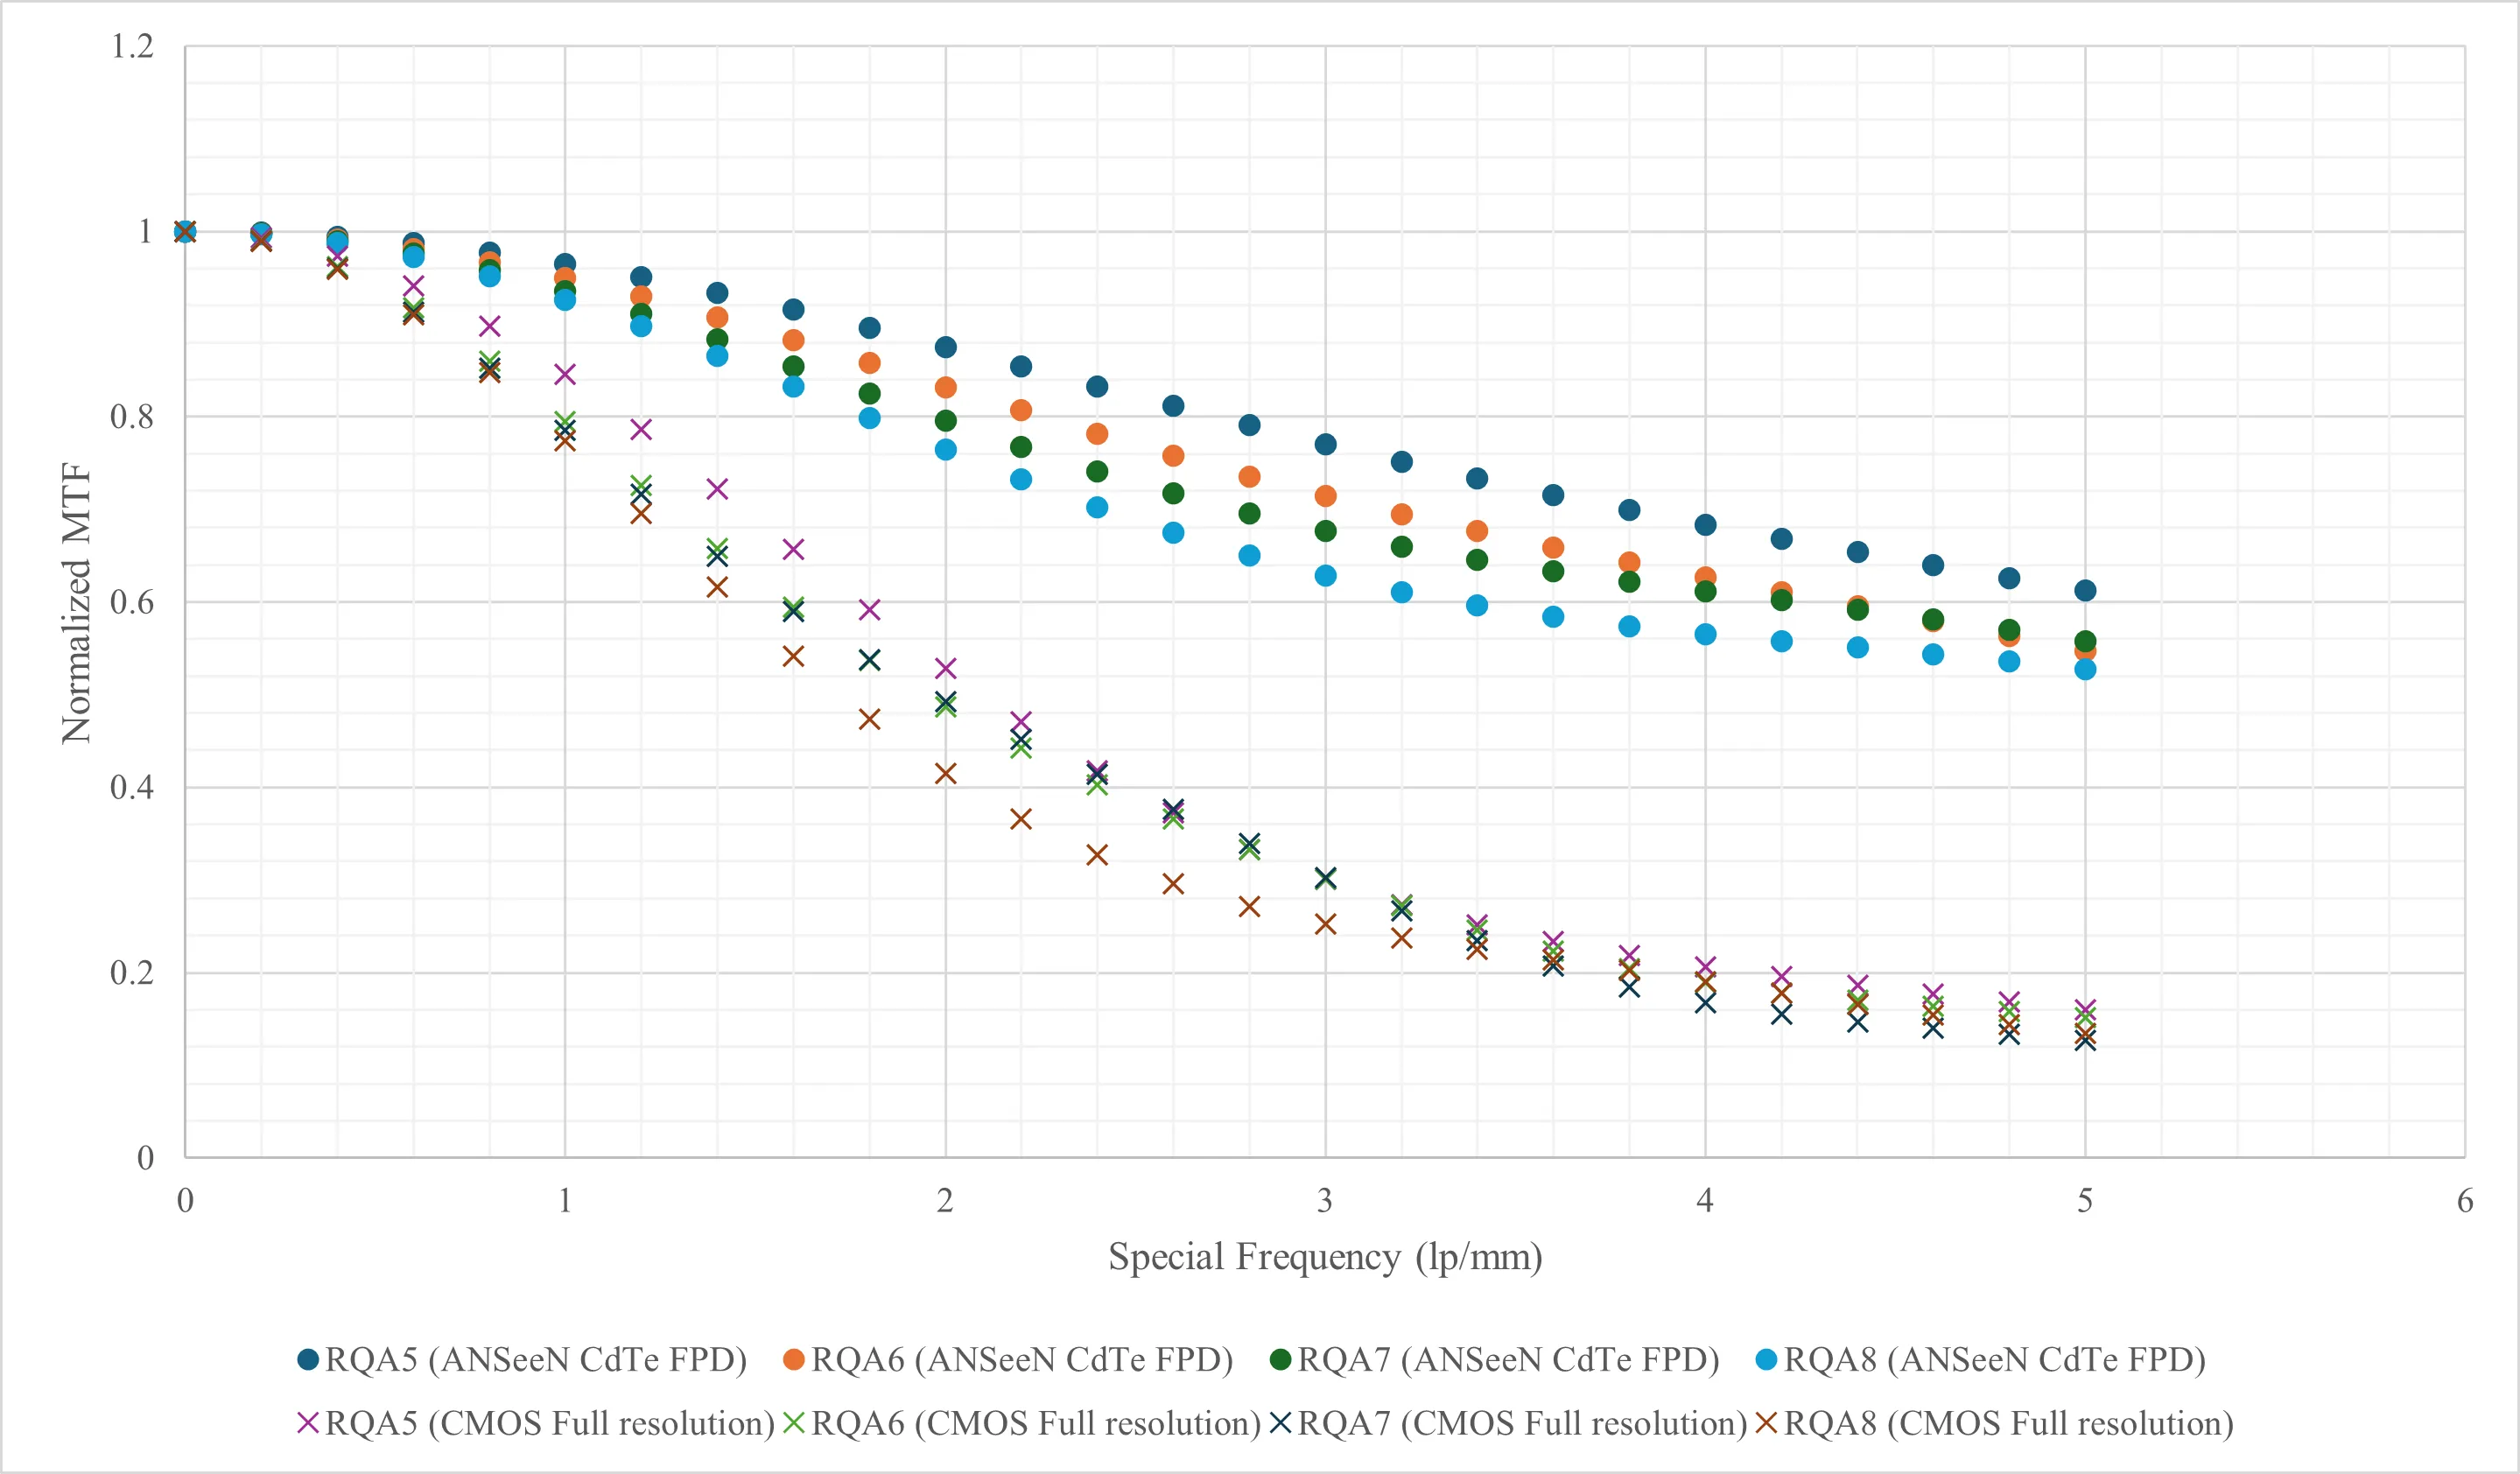
The modulation transfer function (MTF) of the CdTe FPD obtained by the edge method is shown in the figure below. Imaging was performed with a G-311VH-D as the X-ray source for each of RQA5, RQA6, RQA7 and RQA8, at an FID of 880mm, with a tungsten plate placed directly in front of the detection surface. The MTF was calculated from data obtained by integrating 60 images captured at 1 fps.
Pipe Comparison (Transmission Images)
A steel pipe with an inner diameter of 40mm and a wall thickness of 5.4mm was imaged at 2x magnification (FOD 510mm, FID 1020mm), capturing 10 images at 10fps, which were then averaged. In addition to comparing detectors, we imaged at 225kV 0.4mA and at 450kV 0.8mA to evaluate the effect of X-ray tube voltage.
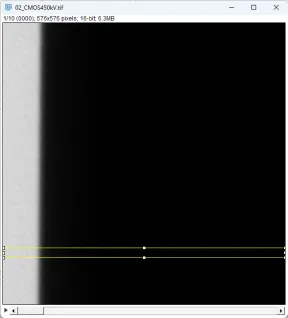
When X-rays pass through a pipe, as shown in the figure below, the wall thickness increases sharply from the outside, and the portion facing the inner surface is the thickest. The thickness then gradually decreases toward the center.

A characteristic of X-rays is that the higher the energy, the greater the penetrating power. This means X-rays pass more easily not only through the pipe being imaged but also through the X-ray detector, leading to lower detection efficiency. As shown in the figures below, we select the background and pipe regions and compare their line profiles.
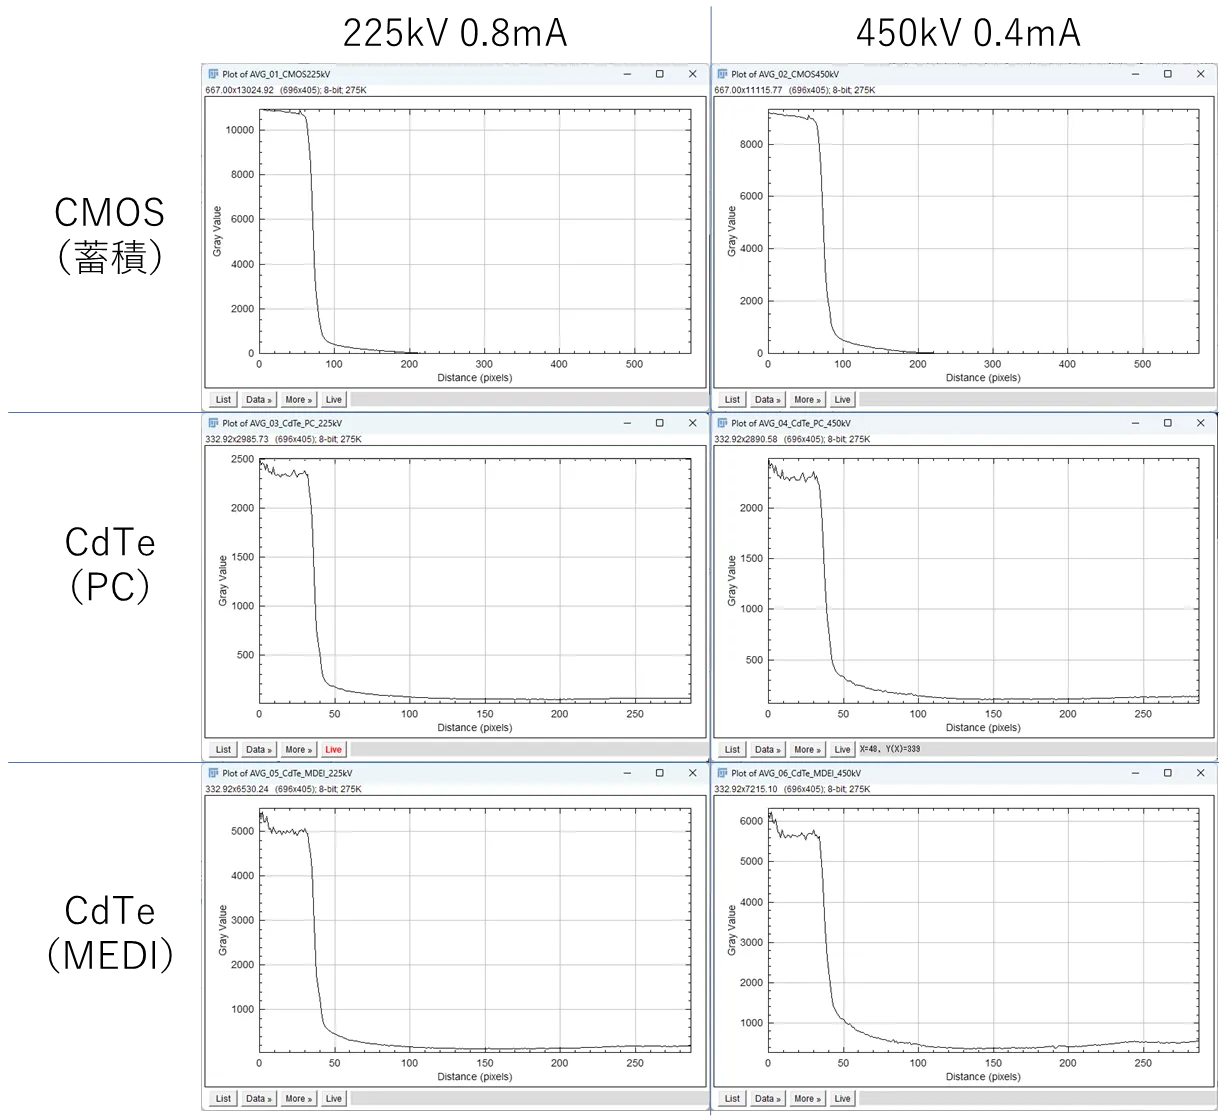
CdTe also responds to high energies, and the thickness is easier to see at 450kV than at 225kV. Furthermore, MDEI mode, with its energy correction, makes the thickness even easier to distinguish.
FPGA Comparison (CT)
The CMOS images were partially cropped before reconstruction so that the imaging range would be the same. Imaging was performed with a millifocus X-ray tube with a focal spot size of 0.4mm at 2x magnification (FOD 510mm, FID 1020mm).
CMOS at 10fps (144 seconds), 225kV 0.5mA
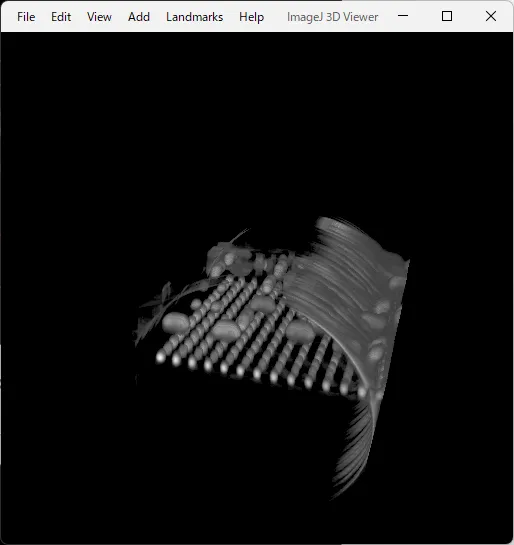
CMOS at 10fps (144 seconds), 225kV 1.0mA
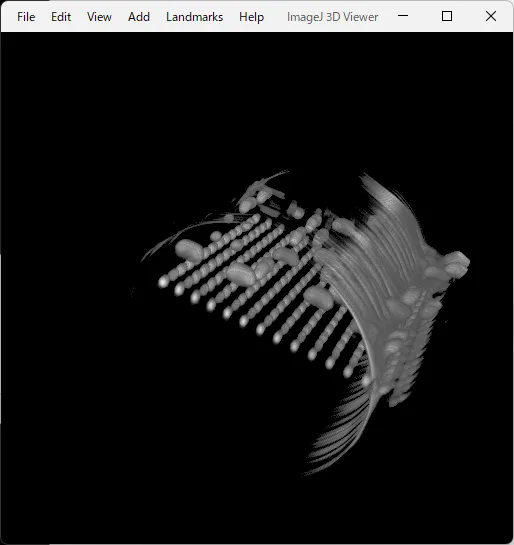
CdTe at 10fps (144 seconds), 225kV 1.0mA
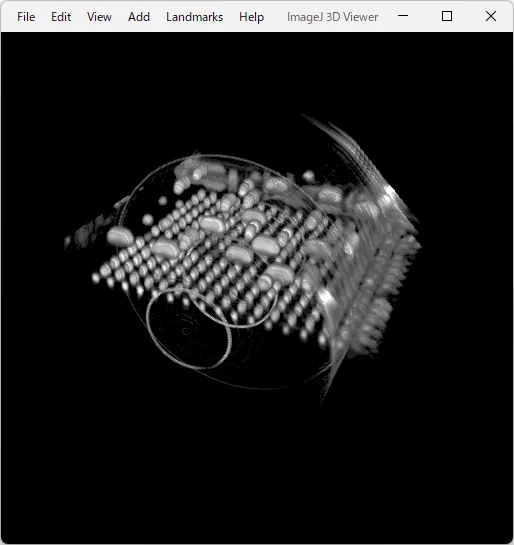
CdTe at 60fps (24 seconds), 225kV 2.0mA
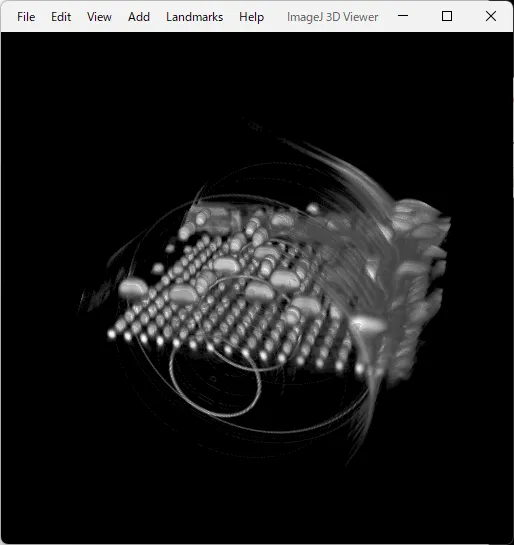
CdTe at 60fps (24 seconds), 225kV 1.0mA
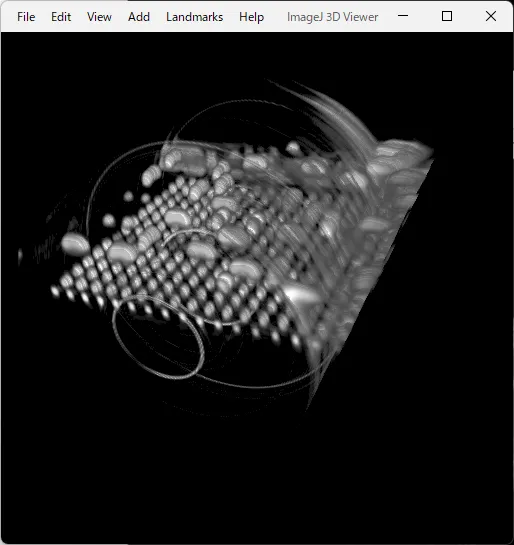
CBCT Imaging Examples
Solder Balls and Bearing Balls
Questions and Demo Imaging
We have a 110kV microfocus X-ray tube and a 450kV millifocus X-ray tube. For samples you would like to have measured, inquiries about the content of this site or our products, or joint development, please contact us below.