

1. X-ray Energy (Wavelength)
X-rays are electromagnetic waves, just like light. Electromagnetic waves with wavelengths of 1/1000 or less of those of visible light are called X-rays (Ref. 1).
The energy of an electromagnetic wave is inversely proportional to its wavelength. In other words, energy discrimination is essentially wavelength discrimination, equivalent to wavelength selection by color filters for visible light. Visible-light digital cameras and similar devices represent color images by using color filters to record red, green and blue (RGB) separately. If wavelengths could likewise be filtered for X-rays, it would become possible to “colorize” this wavelength range, that is, to acquire and use wavelength information.
The X-rays emitted by X-ray sources typically used in industrial and medical applications have wavelengths of 100 pm (picometers) or less. Because these wavelengths are shorter than the interatomic distances in matter, these electromagnetic waves are extremely good at penetrating materials. No wavelength-selective color filters like those used for visible light exist for such extremely short wavelengths, so wavelengths cannot be discriminated in the same way.
2. X-ray Energy Discrimination
One way to discriminate wavelengths in the X-ray range is to exploit the fact that the number of charges generated by the photoelectric effect (Ref. 2) is proportional to the energy of the incident X-ray. Because X-rays carry extremely high energy, each one generates thousands to tens of thousands of charges in a photodiode. For example, an X-ray of 60 keV incident on a CdTe sensor generates 13,500 charges, while an X-ray of 120 keV generates approximately 27,000 charges. Since the photodiode’s response signal is thus proportional to the incident X-ray, the energy of the X-ray can be determined if the charges can be counted accurately. Because this technique counts the incident X-ray photons, it is called “photon counting.”
Measuring a radioisotope (Am241) with a CdTe sensor-based measurement system at an energy resolution of about 2 keV yields a spectrum like the one below (vertical axis: number of radiation events; horizontal axis: radiation energy).
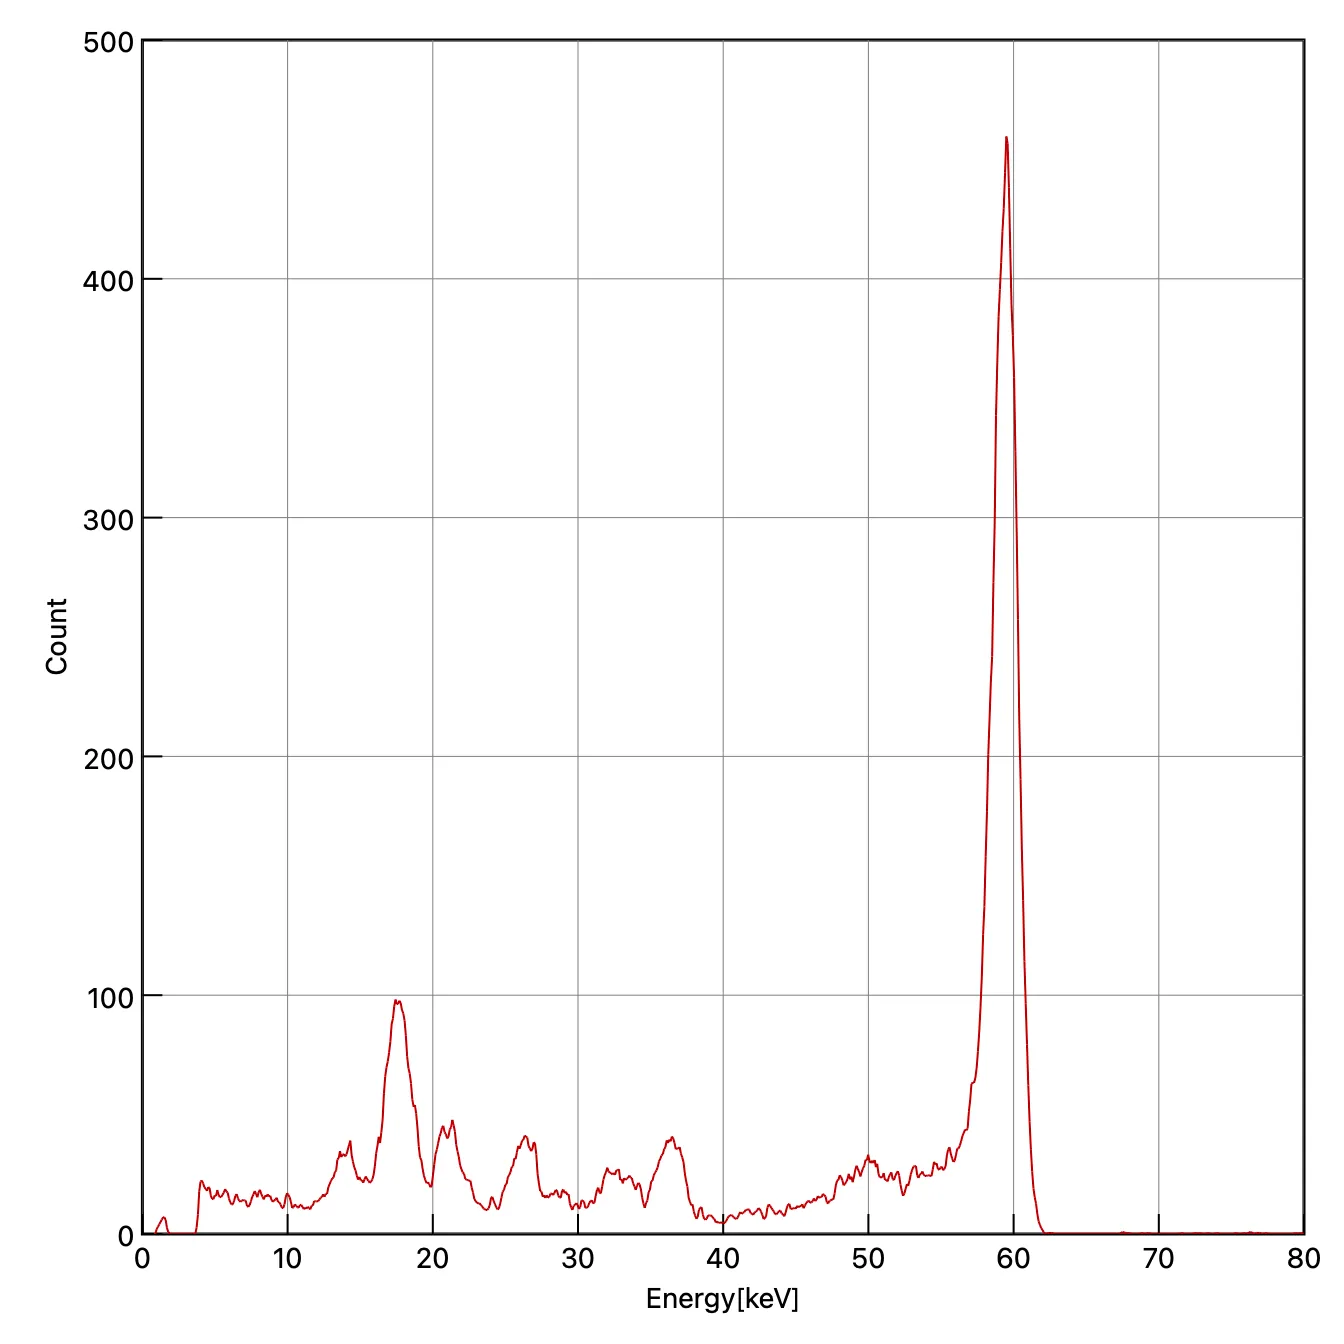 Figure 1: Spectrum of Am241
Data Volume of Energy-Discriminating X-ray Cameras
The photon counting method provides two kinds of information, X-ray frequency and energy, so the amount of information increases accordingly. For visible light, for example, separate R, G and B images are acquired and full color is achieved by calculating color information based on the principle of additive color mixing, giving the following data volume: Visible image data volume = 8 bit * 3 colors * number of pixels For X-rays, on the other hand, the number of energies required is not necessarily three. If eight energies are required, for example, the data volume is as follows: X-ray image data volume = 16 bit * 8 energies * number of pixels As for pixel count, a visible-light single-lens reflex camera has 15 to 60 million pixels, while an X-ray camera covering 20x20 cm at a 0.1 mm pitch has 4 million pixels, so the data volume ranges from about half that of a visible-light camera to roughly the same.
※ When measuring at the energy resolution of Figure 1, the eight energies become 75 energies (150 keV/2 keV), so the data volume is about an order of magnitude larger than that of a visible-light camera.
3. Making Use of X-ray Energy
One application of X-ray energy information is material identification. By acquiring energy information simultaneously during X-ray CT imaging, the atomic number and density can be calculated, allowing materials to be identified directly. Because this can be achieved by acquiring two energies, the technique is called Dual Energy X-ray CT (DECT, DXCT), and it is the most actively researched of the energy-based imaging methods. Imaging methods that use even more energies are called Spectral CT, and applications have been reported in fields such as nuclear medicine research.
As shown in Figure 2, the meaning and dimensionality of the value acquired by the sensor in X-ray imaging (the pixel value) depend on the imaging method. In plain X-ray (radiographic) imaging, the pixel value is the product of the object’s attenuation coefficient and transmission length, so different materials can produce exactly the same pixel value depending on their thickness, making it impossible to tell materials apart. In CT imaging, a tomographic image is obtained by imaging around the entire circumference and reconstructing it, so the transmission length information is resolved into individual pixels and the pixel value represents the attenuation coefficient. This greatly improves the ability to distinguish objects with different attenuation coefficients compared with radiographic images. Using energy information in CT imaging makes it possible to further decompose the attenuation coefficient into the atomic number. As described above, the principle is that by imaging with at least two energies, the differences in attenuation coefficients between materials can be calculated, allowing the atomic number to be estimated.
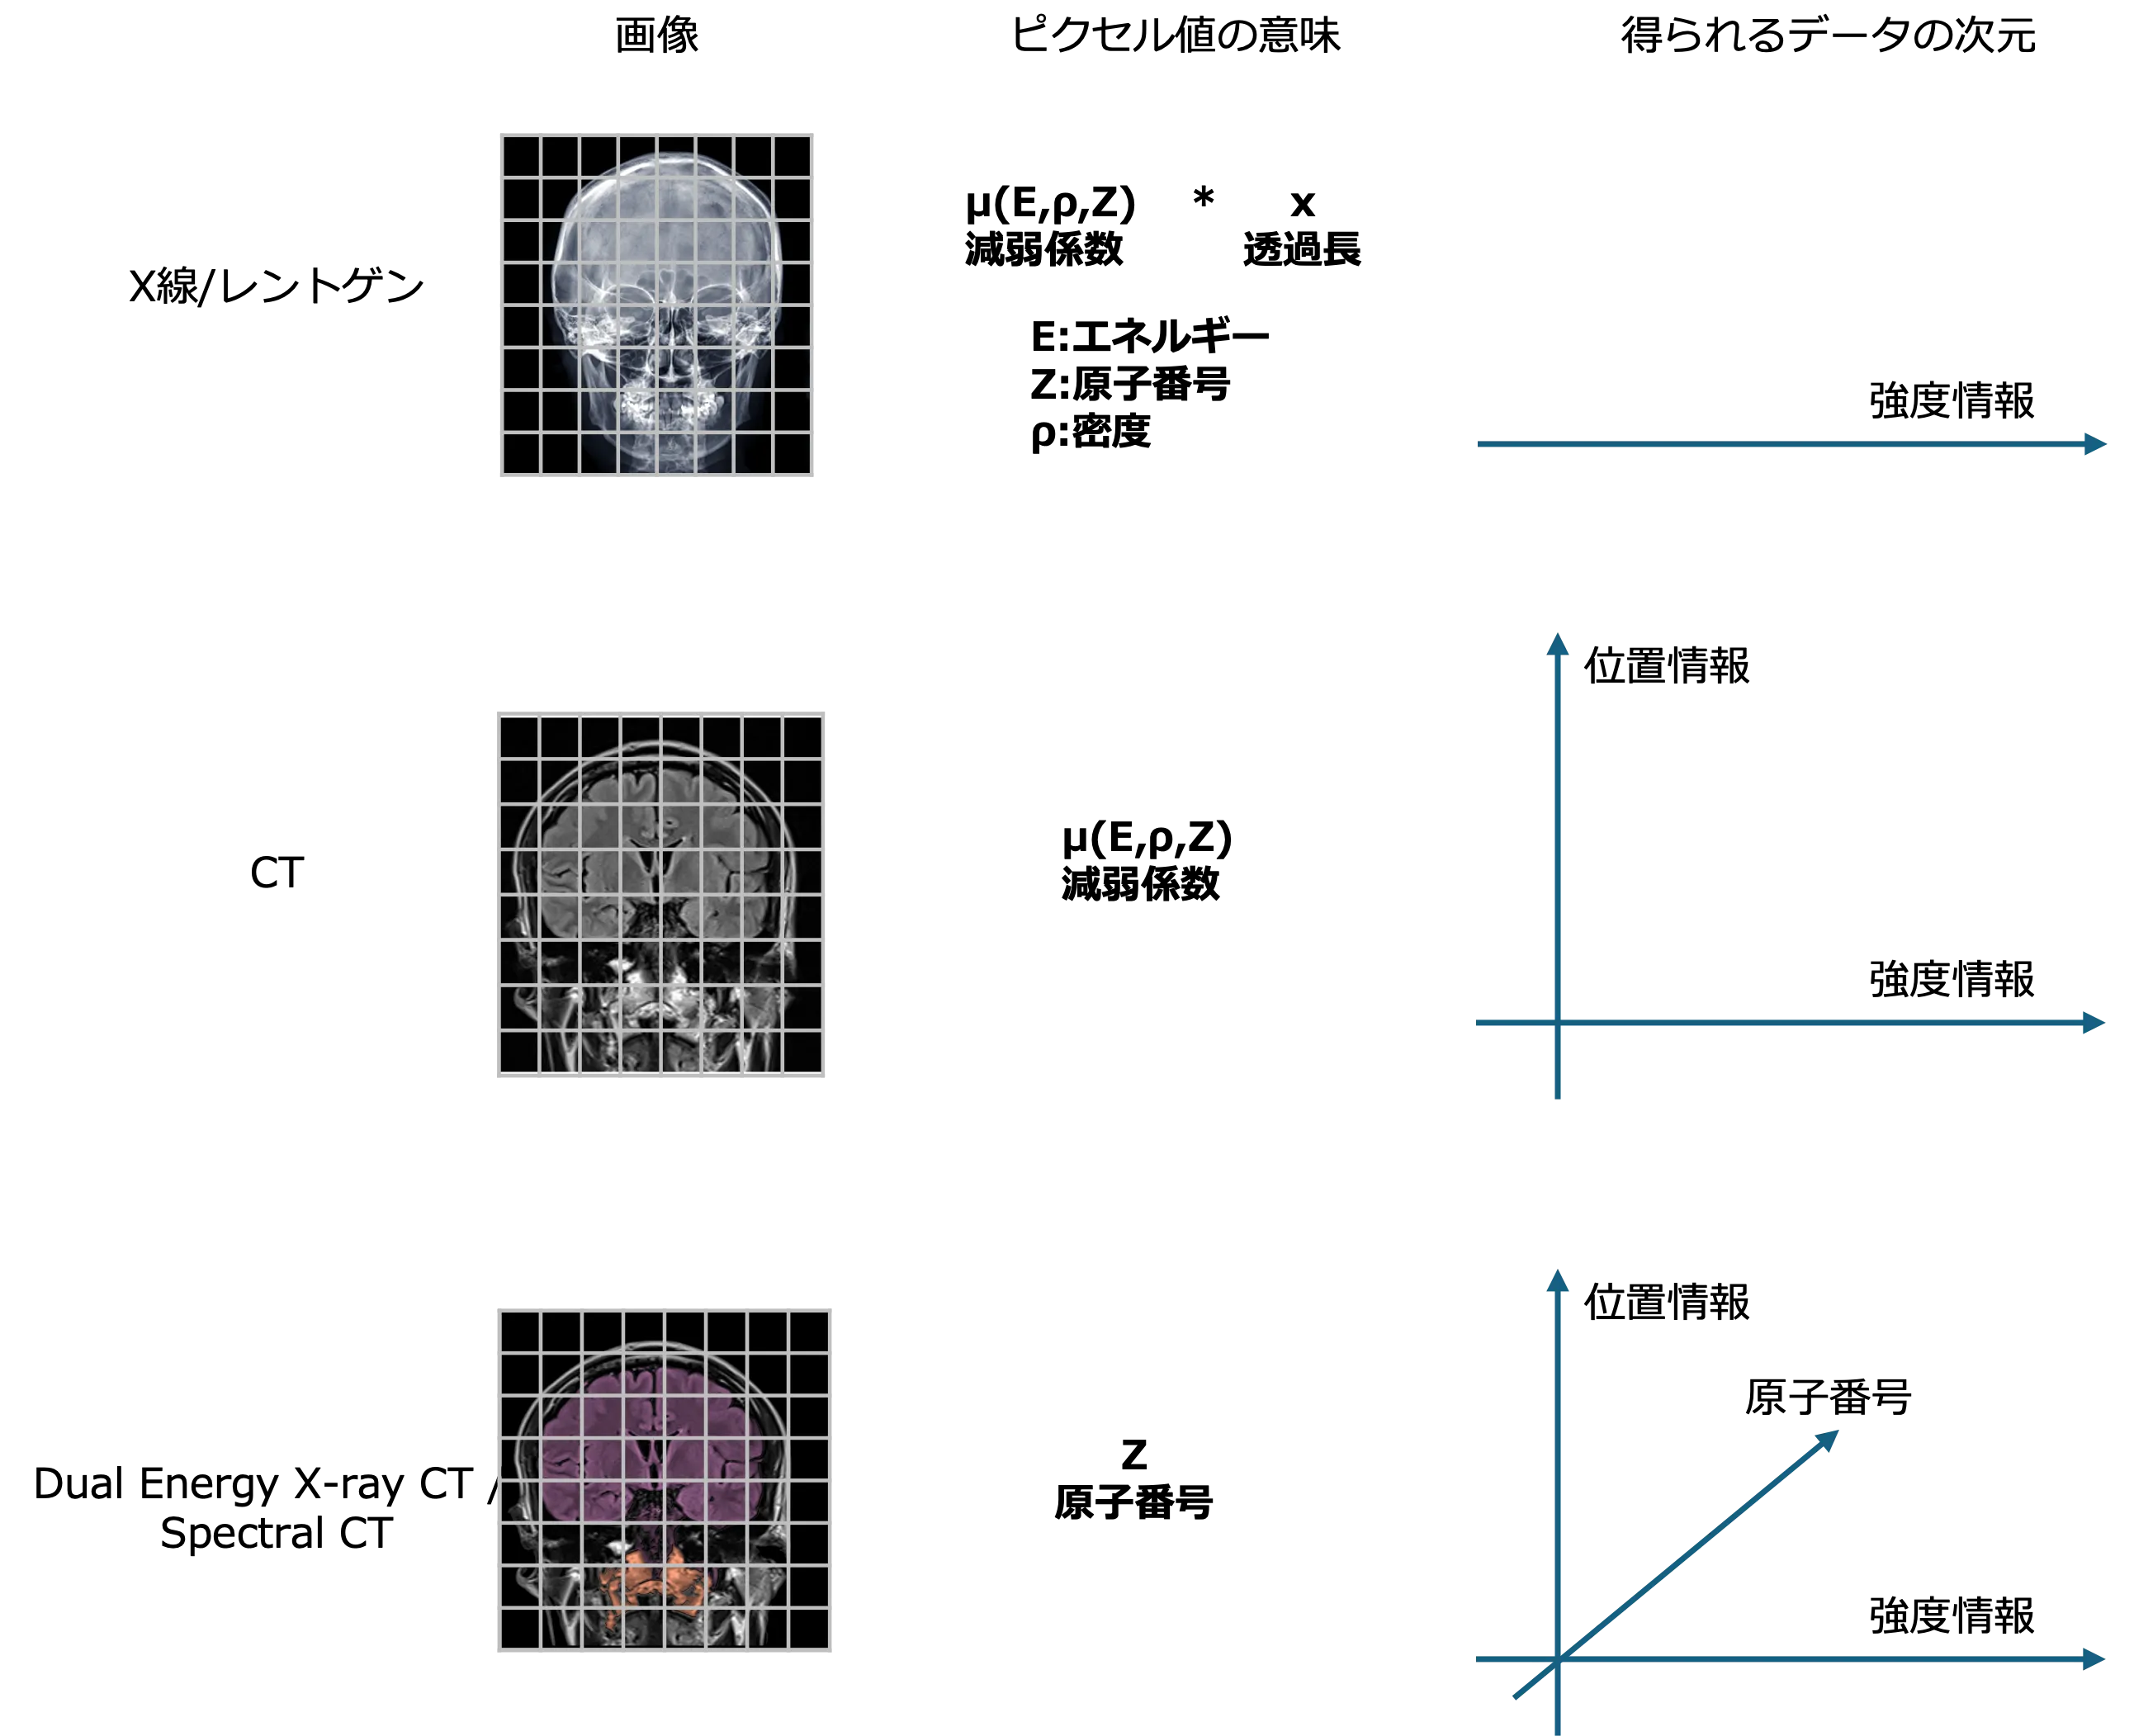 Figure 2: Meaning of pixel values in each imaging method
Attenuation Coefficient
The key to the calculations for estimating atomic number is the attenuation coefficient, which responds differently at each energy depending on the material. As an example, Figure 3 shows the attenuation coefficients of aluminum (Al), copper (Cu) and tungsten (W) from 0 to 300 keV.
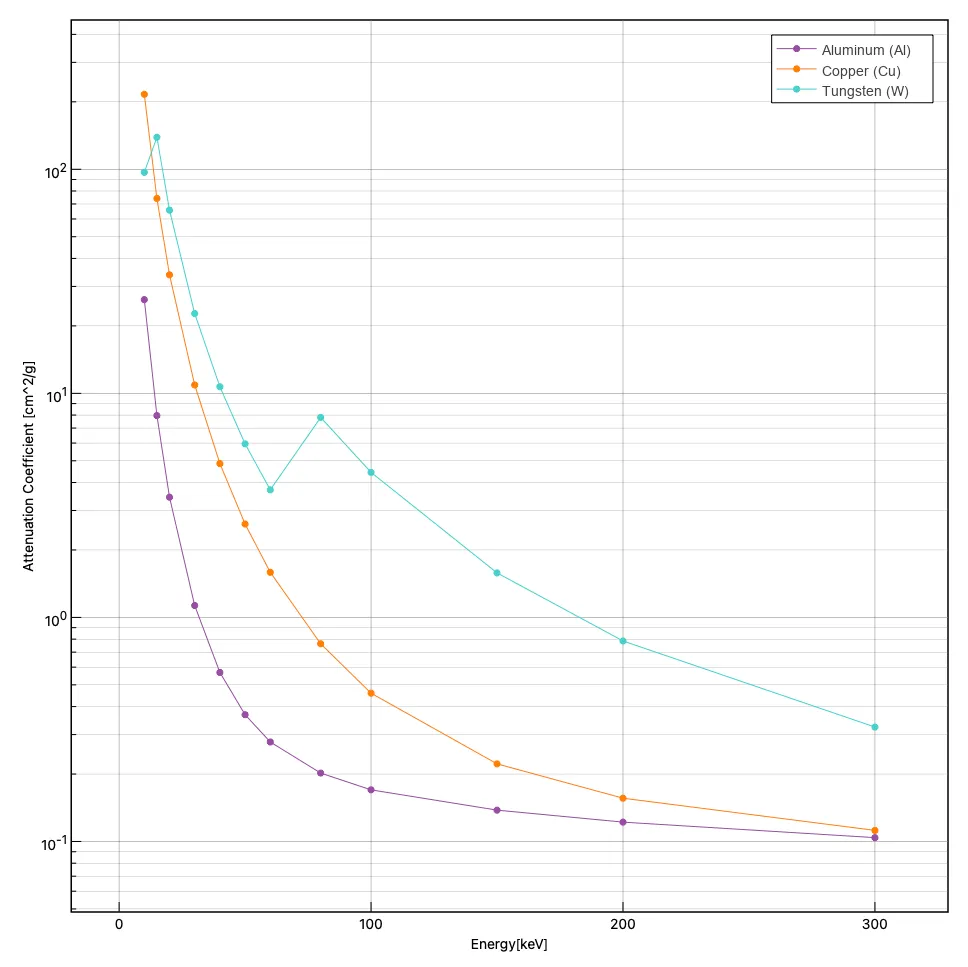 Figure 3: Attenuation coefficients of each material
Example of Material Identification
The images below show an example of detecting simulated explosives using the principle of DECT (Figure 4). In the CT image on the left (a map of attenuation coefficients), there is no significant difference in pixel values among the objects and only differences in density can be seen, but in the density (electron density) image on the right, it is clear that only the explosive (simulated explosive) has a distinctly different electron density.
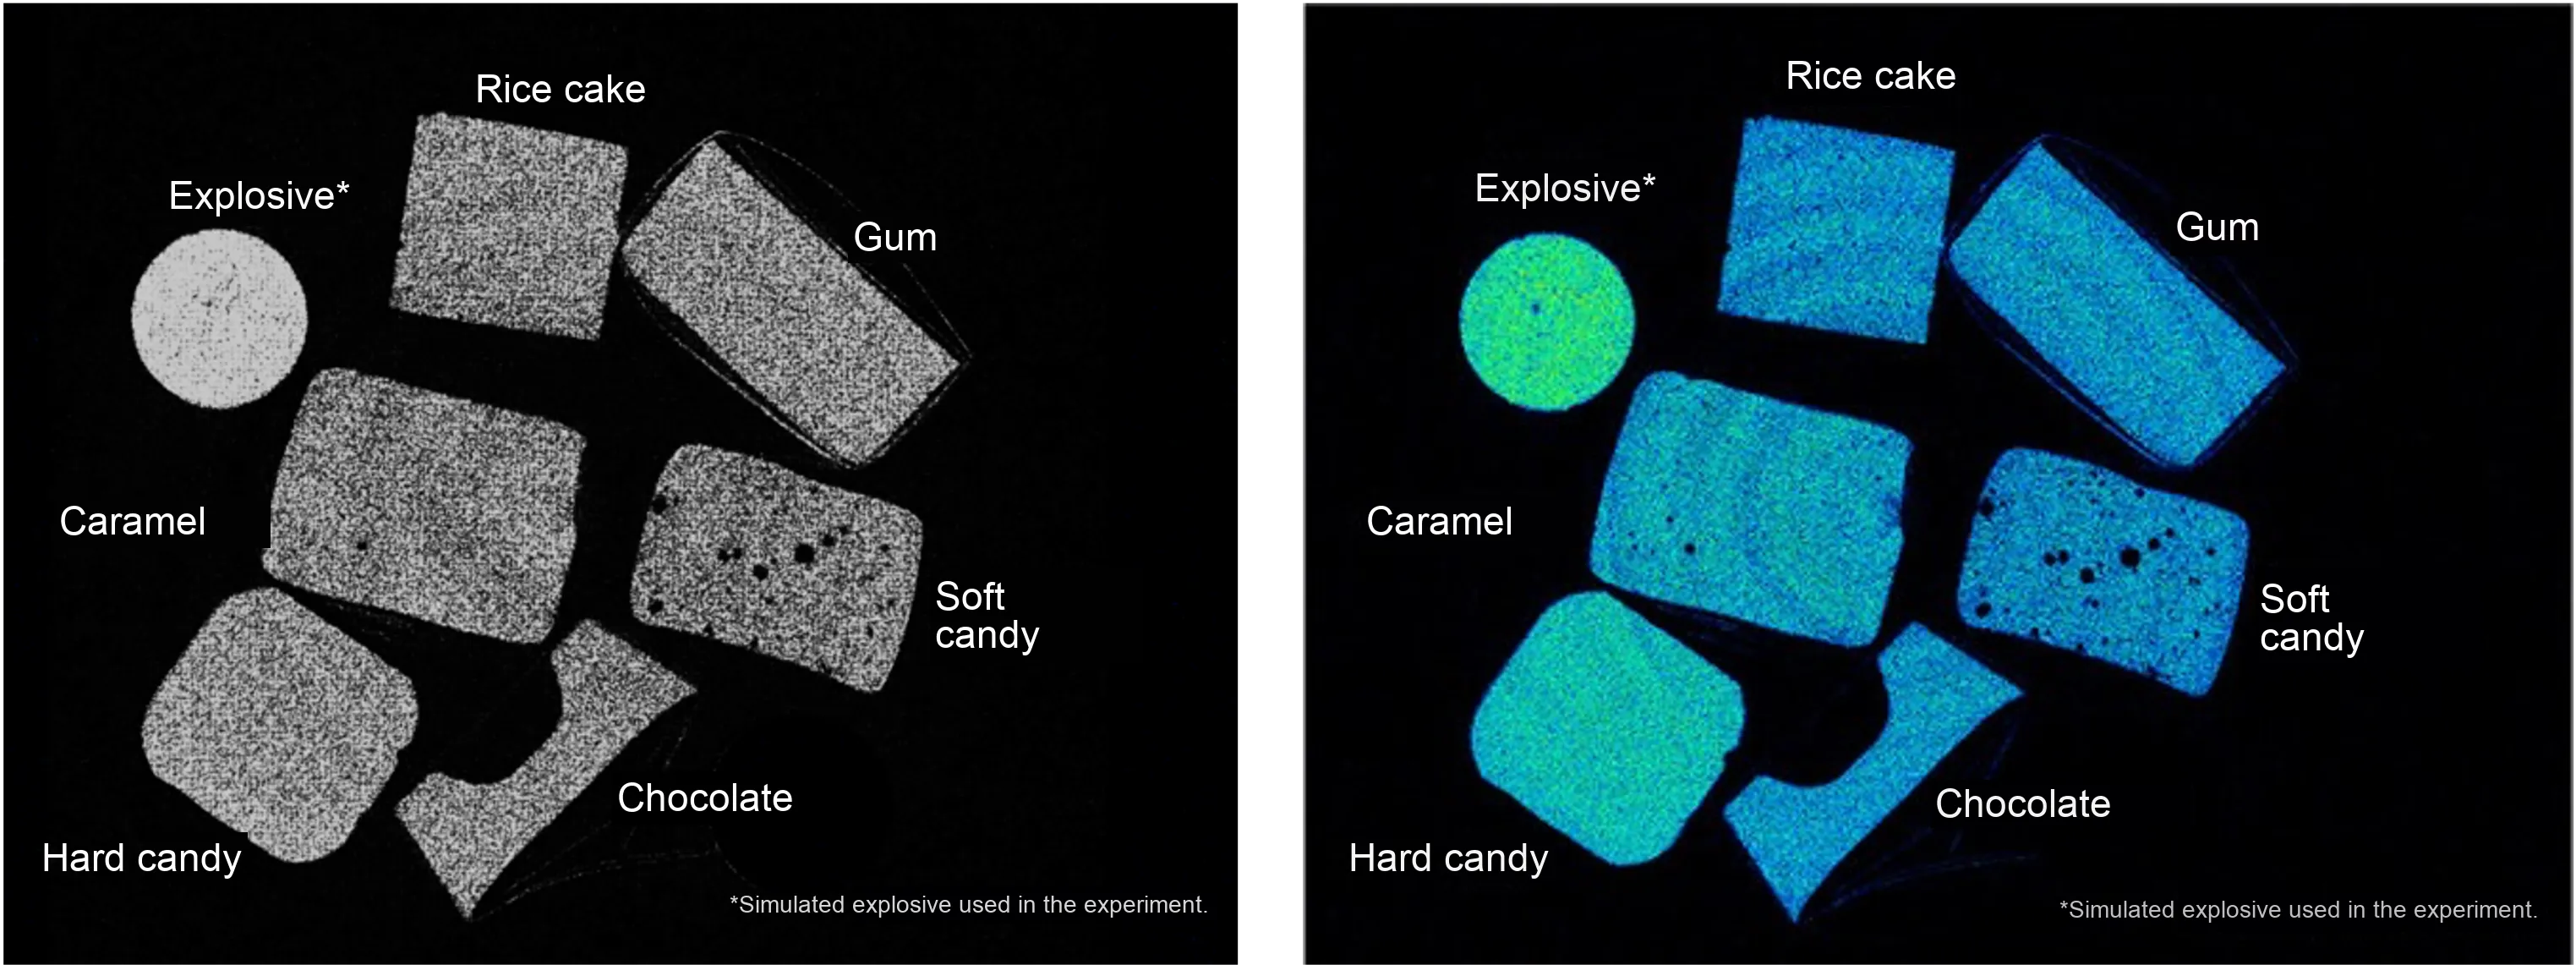 Figure 4: Example of material identification (hazardous material detection)
References
Ref. 1: Light Map (Ministry of Education, Culture, Sports, Science and Technology)
Ref. 2: Photoelectric effect (Wikipedia)